


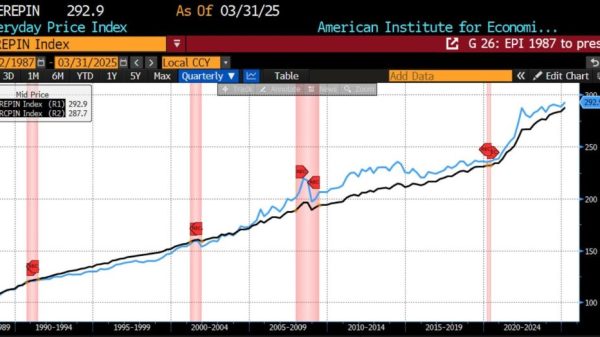


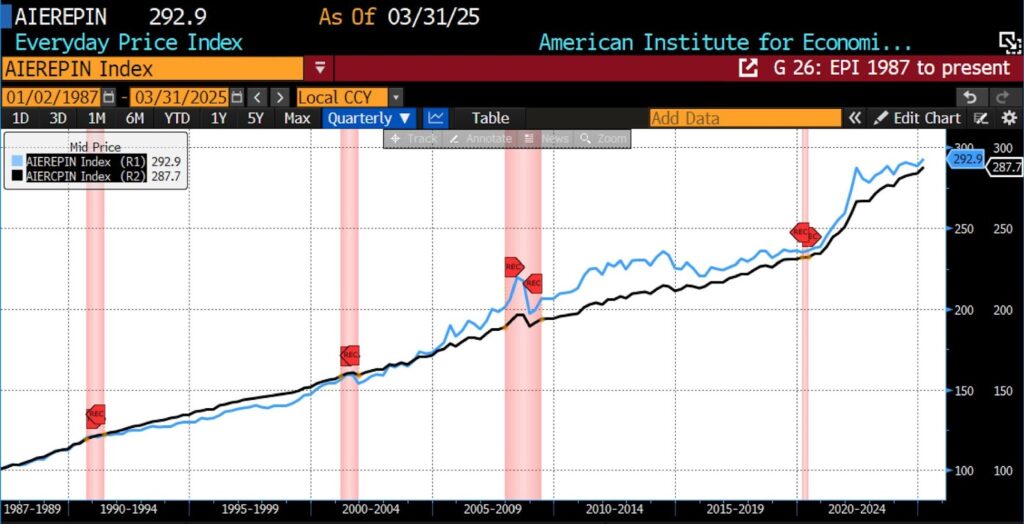
The Everyday Price Index (EPI) rose 0.18 percent in March 2025, bringing the index to 292.9. The March increase brings the number of consecutive increases in the AIER inflation measure to five since November 2024.
AIER Everyday Price Index vs. US Consumer Price Index (NSA, 1987 = 100)
(Source: Bloomberg Finance, LP)
Amid the EPI’s twenty-four constituents 16 rose, six declined, and two were unchanged from February to March 2025. The largest price increases occurred in the recreational reading materials, audio discs tapes and other media, and tobacco and smoking products categories. The most pronounced declines were seen in prices of cable satellite and live streaming TV services, motor fuel, and prescription drugs.
Also on April 10, 2025, the US Bureau of Labor Statistics (BLS) released its March 2025 Consumer Price Index (CPI) data. The month-to-month headline CPI number fell by 0.1 percent, less than the 0.1 percent forecast. The core month-to-month CPI number increased by 0.1 percent, also 0.2 percent less than the 0.3 percent increase expected.
March 2025 US CPI headline & core month-over-month (2015 – present)
(Source: Bloomberg Finance, LP)
In March, energy prices fell sharply, with the index declining 2.4 percent — driven by a 6.3 percent drop in gasoline, which outweighed gains in natural gas (3.6 percent) and electricity (0.9 percent). Meanwhile, food prices rose 0.4 percent, led by a 0.5 percent increase in food at home and a 0.4 percent rise in food away from home. Within groceries, meats, poultry, fish, and eggs surged 1.3 percent, with eggs alone up 5.9 percent and beef up 1.2 percent. Dairy rose 1.0 percent, other food at home rose 0.5 percent, and nonalcoholic beverages climbed 0.6 percent. Fruits and vegetables declined 0.5 percent — led by a 3.5 percent drop in lettuce — and cereals and bakery products edged down 0.1 percent. For dining out, full service meals increased 0.6 percent and limited service meals rose 0.2 percent.
Core inflation (excluding food and energy) edged up just 0.1 percent in March, following a 0.2 percent rise in February. Shelter contributed modestly, with overall shelter up 0.2 percent, rent up 0.3 percent, and owners’ equivalent rent rising 0.4 percent, while lodging away from home fell 3.5 percent. Notable increases included personal care (1.0 percent), education and apparel (both 0.4 percent), and new vehicles (0.1 percent). Medical care rose 0.2 percent, with hospital services up 1.1 percent and physician services up 0.3 percent, though prescription drugs dropped 2.0 percent. Airline fares plunged 5.3 percent, following a 4.0 percent drop in February. Additional declines were seen in motor vehicle insurance, used cars and trucks, and recreation, while household furnishings and operations were flat. March inflation data, overall, hints at easing pressures in core goods and services, even amid localized price spikes in key food categories.
On the year-over-year side, the March 2024 to March 2025 headline CPI reading came in at 2.4 percent, lower than forecasts of a 2.5 percent rise. Core CPI in this category also came in under surveys, registering a 2.8 percent rise versus an expected 3.0 percent increase.
March 2025 US CPI headline & core year-over-year (2015 – present)
(Source: Bloomberg Finance, LP)
For the 12 months ending in March 2025, core inflation (excluding food and energy) rose 2.8 percent, marking its smallest annual increase since March 2021. Food prices increased 3.0 percent over the same period, with food at home up 2.4 percent. Notably, the meats, poultry, fish, and eggs category surged 7.9 percent, driven by a staggering 60.4 percent rise in egg prices. Other food-at-home components saw more modest increases: dairy and related products rose 2.2 percent, nonalcoholic beverages rose 2.4 percent, and cereals and bakery products gained 1.1 percent, while fruits and vegetables declined 0.7 percent. Meanwhile, food away from home climbed 3.8 percent year-over-year, with full-service meals rising 4.1 percent and limited-service meals up 3.4 percent.
The energy index fell 3.3 percent over the past year, exerting a strong downward pull on headline inflation. Gasoline prices dropped 9.8 percent, and fuel oil declined 7.6 percent over the same period. Not all energy components moved lower, however — electricity prices increased 2.8 percent, while natural gas rose a steep 9.4 percent. These mixed results within the energy sector highlight divergent inflation pressures across household utilities and transportation fuels. The data underscore moderating core inflation but continued volatility in food and energy prices, reflecting both easing demand in some sectors and persistent supply-side pressures in others.
The March CPI report revealed a surprisingly mild inflation picture, one with little evidence that the recent wave of tariff hikes — specifically the 20-percentage-point increase on Chinese imports in February and March — are being passed through to consumers. Key goods categories that are heavily reliant on Chinese imports, including apparel, furnishings, and recreation products, saw either outright price declines or only modest gains. Meanwhile, core services inflation decelerated sharply, driven by falling prices in discretionary travel categories like airfares, hotels, and car rentals. Of particular note, the softness occurred even as owners’ equivalent rent (OER), a major CPI component, rose 0.4 percent.
The data suggests that consumers and perhaps small businesses are pulling back on discretionary spending in both goods and services. Although further tariff hikes — including a 125 percent levy on Chinese goods and a 10 percent universal tariff effective in April — may eventually raise input costs, current trends imply that businesses will absorb much of the pressure via margin compression rather than passing it on to consumers.
While public focus remains on goods inflation and tariff effects, both the March CPI data underscores that housing remains the central inflation driver within services. Shelter prices continued to rise moderately, though hotel costs posted their steepest drop in over three years. Some persistent price pressures remain — grocery prices rose 0.5 percent, matching the largest increase since October 2022, and meat costs accelerated — but eggs saw a more tempered rise than in prior months. Services categories like car rentals and insurance declined, helping to pull down services inflation excluding housing and energy by the most in nearly five years. This alternative services measure, often used by policymakers, is captured more fully in the Fed’s preferred metric — the personal consumption expenditures (PCE) price index — which assigns less weight to housing. All in all, today’s numbers reinforce expectations that the Federal Reserve will remain patient before restarting any monetary easing.