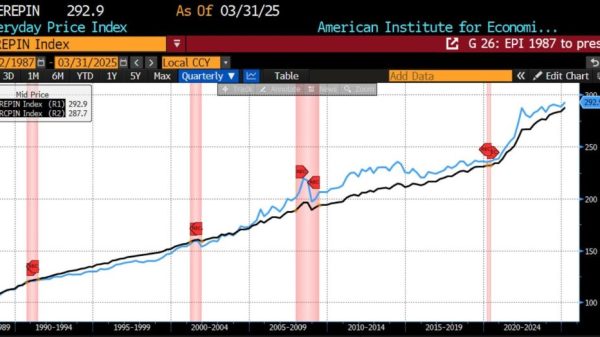
After a quarter-long inflationary resurgence, it looks like prices are now falling. The Bureau of Labor Statistics reported that the Consumer Price Index (CPI) declined 0.1 percent in March. Prices rose 2.4 percent year-over-year, compared with 2.8 percent last month. The biggest decrease was for energy, which fell 2.4 percent. Gasoline prices were down 6.3 percent.
Excluding volatile energy and food prices, inflation stayed in positive territory. Core CPI rose 0.1 percent in March (2.8 percent year-over-year). But this is lower than February’s 0.2 percent monthly increase.
This is good news. Both headline and core inflation are heading in the right direction. But the Federal Reserve’s job might not get easier. Fed Chair Jerome Powell recently noted that Trump’s tariffs may complicate the Fed’s task by pushing up prices. This would be a one-time price increase rather than sustained inflation. Yet it might compel monetary policymakers to respond anyway.
We don’t know for sure whether disinflationary trends will continue. But if they do, we will get closer to the goals monetary policymakers have been chasing for more than a year.
The current target range for the federal funds rate, the main barometer of monetary policy, is 4.25 to 4.50 percent. From BLS’s most recent data, the continuously compounded annual inflation rate is -0.60 percent. Hence the inflation-adjusted fed funds rate target is between 4.85 to 5.10 percent. We can use these figures to infer the stance of monetary policy.
First, we need an estimate for the natural rate of interest, which is the short-term capital price that balances supply and demand. The economy will operate as close to its productive potential as possible, with inflation low and stable, if the natural rate of interest matches the (inflation-adjusted) market rate of interest. The New York Fed puts the natural rate of interest between 0.80 and 1.31 percent. The Richmond Fed’s model suggests it’s between 1.15 and 2.61 percent. Either way, market interest rates significantly exceed the natural rate estimates. This is a stark contrast to recent months! Now it looks like money is tight.
Money supply and money demand data tell a different story. The M2 money supply grew 3.84 percent over the past year. The broader aggregates rose between 3.41 and 3.50 percent over the same period. In comparison, money demand (proxied by the sum of real GDP growth and population growth) grew roughly 3.3 percent year-over-year in Summer 2024, the most recent period for which we have data. The money supply is growing about the same as money demand. This suggests monetary policy is approximately neutral.
Last month’s deflation significantly affects our estimates of inflation-adjusted market interest rates. This explains the big discrepancy between the interest rate data and the monetary data. We shouldn’t overcorrect from a single month of falling prices. But monetary policymakers should definitely keep their eye on things. Overtightening could impose needless costs on the economy by slowing job and output growth.
The Federal Open Market Committee next meets in early May. That’s a ways off, and there will be several more data releases before then. Again, fallout from tariffs might cause Fed officials to refrain from monetary loosening. We can’t speculate too much on how they will react to the March CPI figures specifically. It’s just one of many factors to consider.
If disinflationary or deflationary trends continue, a cut to the target rate range would be appropriate. Yet we must remember the FOMC is on guard against inflationary resurgences. We just had one, after all. And let’s not forget the specter of political pressure on the Fed. All these factors make it very difficult to predict how they will adjust policy.


